To ensure the land data that Rural Payments Agency (RPA) holds is as up to date as possible, RPA systematically reviews and updates data held on the Rural Land Register each year. Accurate land means we are making accurate payments to farmers and land managers.
RPA does this through a process called Proactive Land Change Detection (PLCD) where we systematically review and update data which hasn’t been reviewed during the past three years. This runs during a three-month period between December and February each year, so updates are published after the outstanding Basic Payments Scheme payments have been processed, and before pre-population of claim forms for the following scheme year.
RPA does this by checking and updating digital land parcels and land covers, using evidence from the latest available data sources. These include aerial photography, satellite imagery and Ordnance Survey MasterMap updates. We only use evidence that is less than three years old to carry out mapping updates. We decide if a digital land parcel needs to be updated based on the latest evidence we hold.
If, as part of PLCD, a mapping update is made to your land, you will be notified through the Rural Payments service. Updates such as boundary changes, area changes or land cover changes can be important and can affect your agreements and/or payments.
During the last round of PLCD updates, only 4% of the land parcels updated were returned to RPA for further amendment. However, if you have any concerns about the changes, you can use an RLE1 form to request further mapping changes.
We review changes which are visible at a map scale of 1:2.500, and we only map significant changes to land parcel boundaries or the land covers within them.
We review approximately one third, or 900,000 of our land parcels each year. The change rate is currently around ten per cent and this has dropped year on year since PLCD was introduced in 2017.
Examples
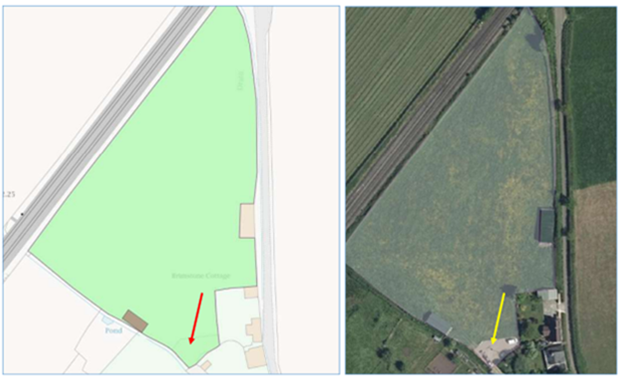
CHANGE: Above is an example of where we would make a change – the car park on the southern boundary should be removed from the land parcel.
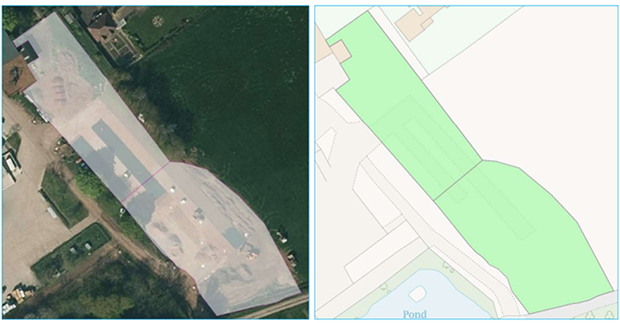
CHANGE: The farmyard area in the picture above would be changed from permanent grassland land cover to ineligible land covers reflecting what is visible in the aerial photography and partially captured in OS MasterMap.
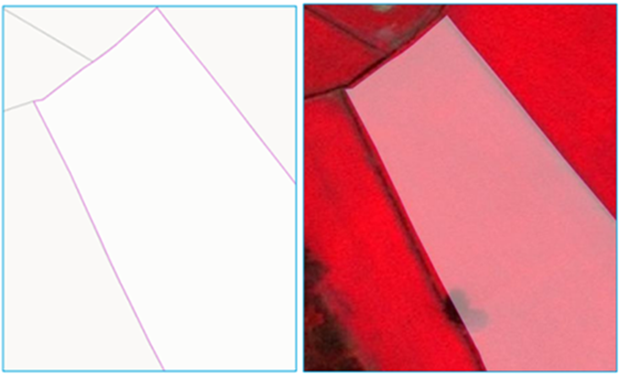
NO CHANGE: Here we wouldn’t make a change because, although the boundaries don’t quite align, we can see this is because of a misalignment in the imagery.
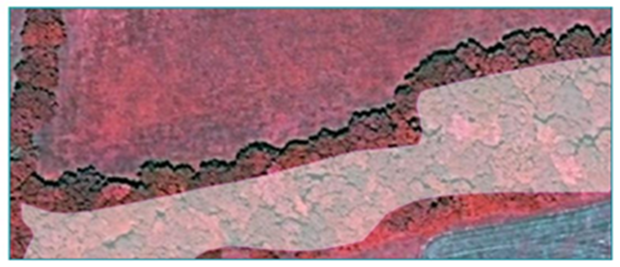
NO CHANGE: And here we wouldn’t amend the boundary of this woodland parcel as we can see that the tree canopy is obscuring the real boundary on the ground.
1 comment
Comment by Emma posted on
I am GIS Officer for a large SSSI. We have had to submit over 500 corrections to the RPA parcels, and your Proactive Land Change Detection process often reverts them back to the incorrect version a year later. There are several reasons for this:
1) the OS mapping for our area is not kept up to date and accurate; they do not survey here regularly.
2) most of the land is wood pasture, which is a mixed habitat where boundaries are not distinct and are often obscured by trees in aerial photos.
3) the mapping that you use takes no account of ownership boundaries, which may be different from land cover boundaries, for example where a strip of land by a road is designated highway but is not fenced off from the forest.
Please can you stop wasting our time with your automated process, and allow our corrections to remain permanent until informed otherwise?